Project Overview
Goal
Our goal is to identify the most popular pizza products and optimal sales strategies for our pizzeria. To achieve this, we will analyze sales data from our Excel spreadsheet containing information on Pizza Categories, Sizes, Pricing, Order Dates, Quantities Sold, and Revenue Performance.
Download from GitHub!Setup
The data was prepared by standardizing date formats for order dates and currency formats for price columns. All data types were verified to ensure analysis quality.
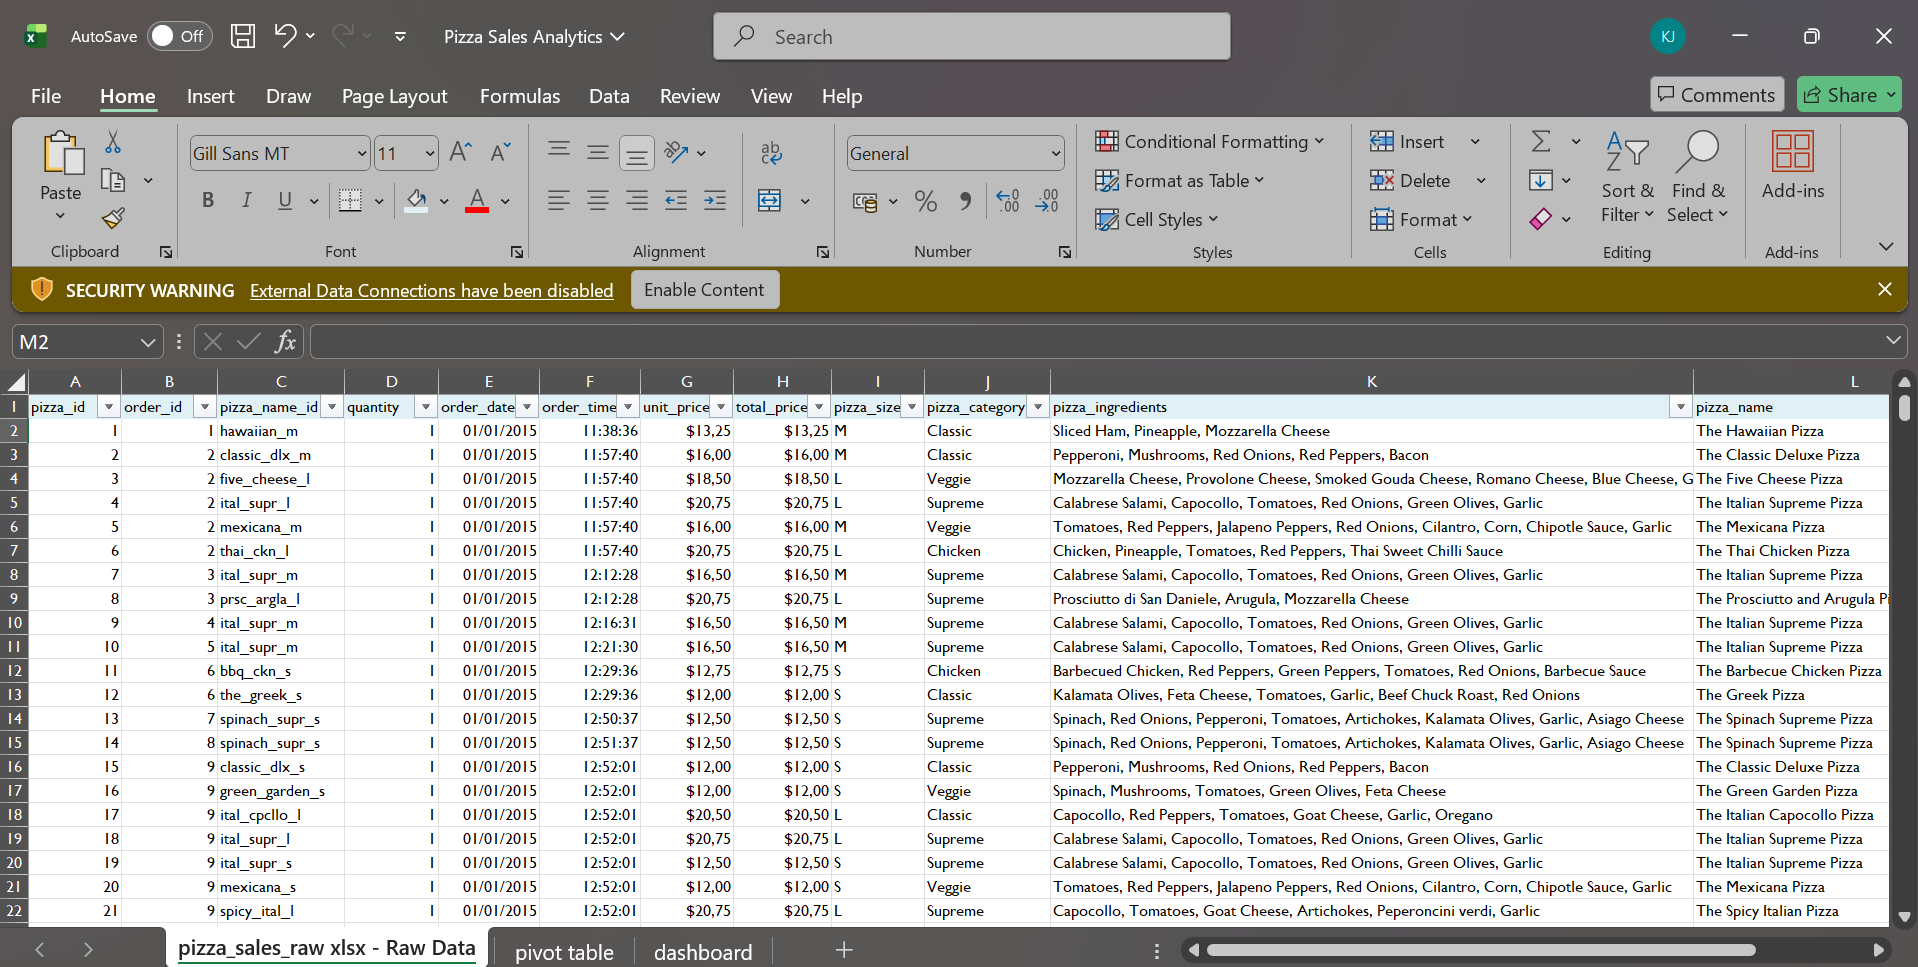
Fig 1. This image shows the dataset after it was cleaned.
Proper data formatting is crucial for accurate analysis. All 48,620 records have been standardized and are ready for processing.
Analysis
Now that we have clean data, we can perform exploratory data analysis to gain insights and patterns in the data.
Business Questions:
- What is the average value of each order?
- Which specific pizza names are the top sellers by quantity?
- Which pizza size is the most popular?
- Which pizza category contributes the highest percentage of sales?
- Which month had the highest revenue, indicating the peak sales period?
- What is the overall revenue trend throughout the year?
By answering these questions, pizza shops can better understand what customers like. This insight allows them to strategically adjust their menus, optimize pricing, and run targeted promotions that increase sales and customer satisfaction.
Data Exploration
We will start by grouping our sales data based on pizza categories, sizes, specific pizza names, and time periods.
I used the sales order data to create pivot tables that group performance based on these key criteria. Using these groups, I created charts that visually display the key sales insights, such as revenue trends and product performance. I also used various aggregation functions to perform critical calculations for total revenue, average order value, and sales distribution.
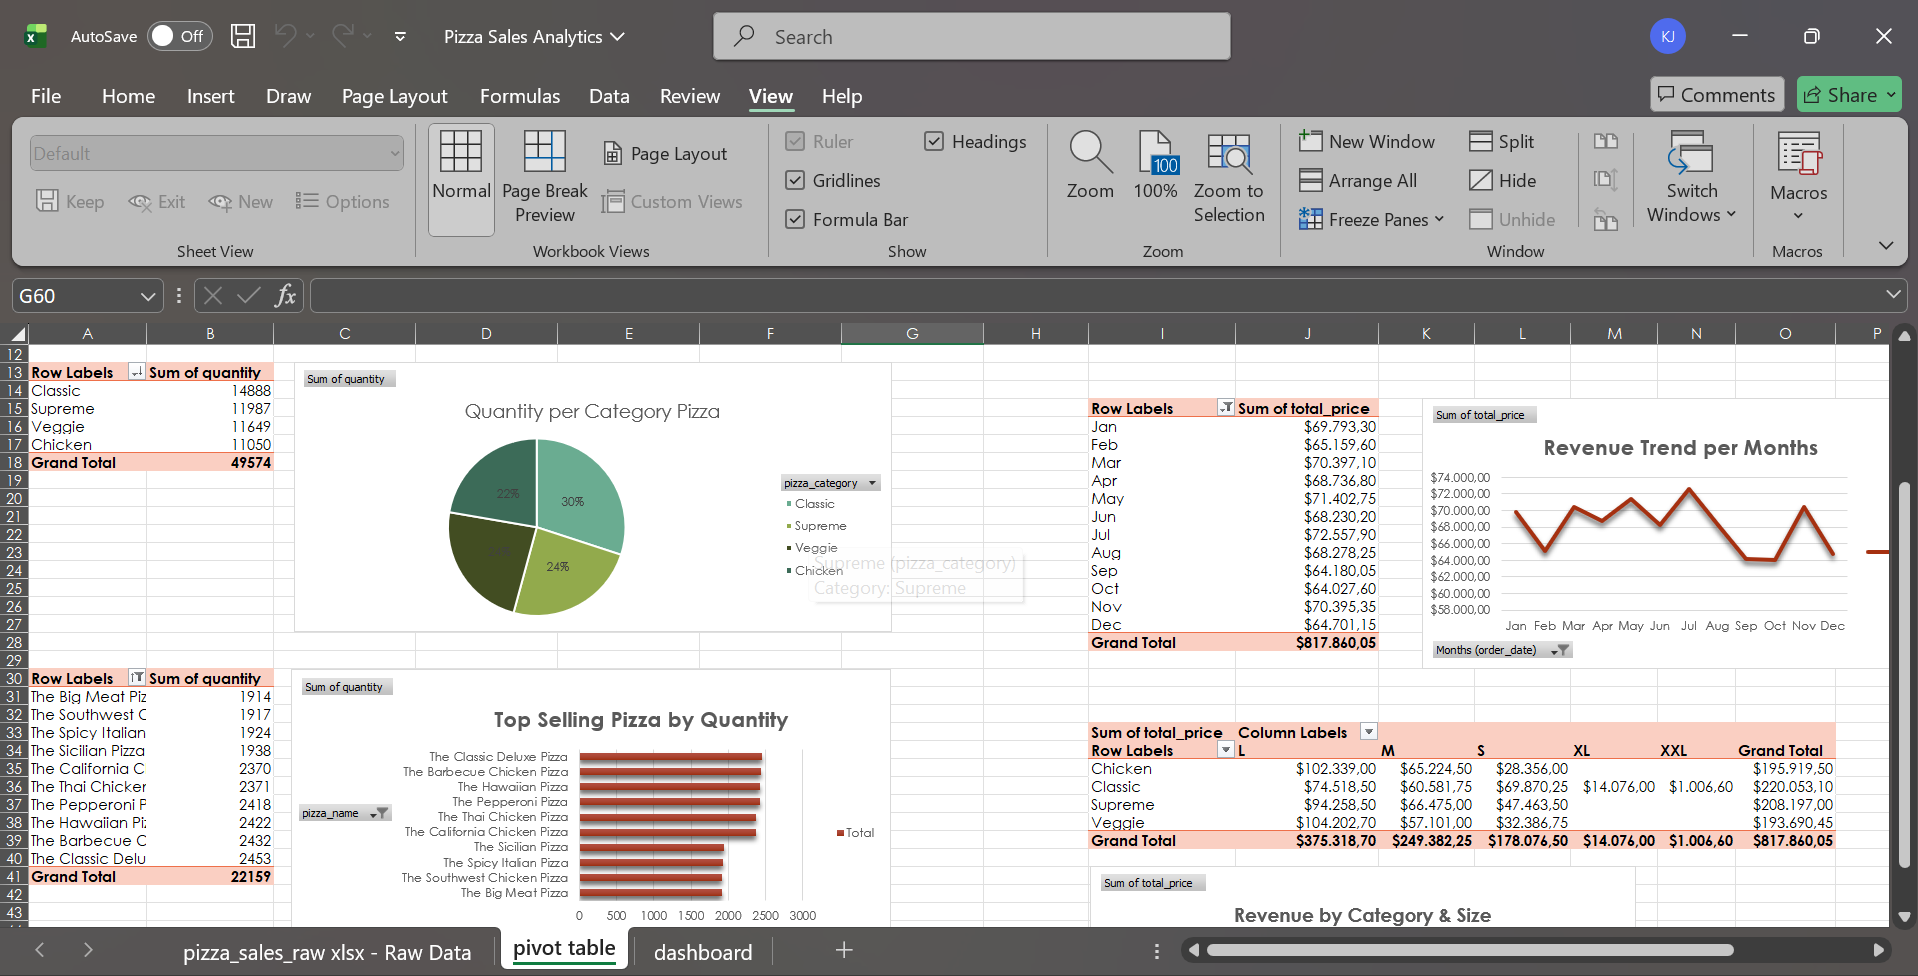
Fig 2. This image shows the different pivot tables and charts.
To easily view all this information at once, I created a dashboard that displays all the graphs. I also added a slicer feature to the dashboard, allowing users to filter the data based on various criteria. This makes it easier to identify the customer segments most likely to buy bikes.
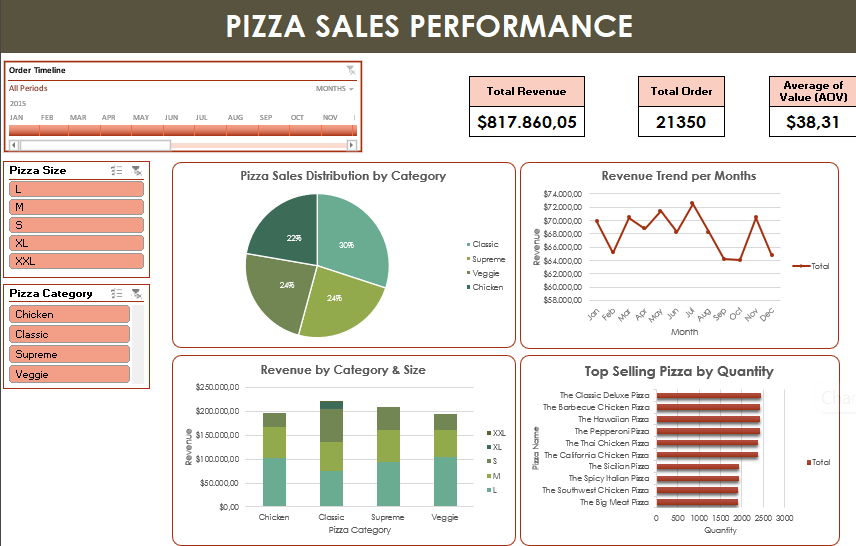
Fig 3. This image shows the Pizza Sales Dashboard.
Key Findings
Using the dashboard, we were able to determine the following insights:
- Average order value (AOV): The average order value for pizza sales is $38.31 per order.
- Top selling pizza by quantity: The most popular pizza is the
- The Classic Deluxe Pizza.
- The Barbecue Chicken Pizza.
- The Hawaiian Pizza.
- The Pepperoni Pizza.
- The Thai Chicken Pizza.
- Most popular pizza size: The most popular pizza size is the large size.
- Best-selling category: The Classic pizza category contributes the highest sales percentage at approximately 30%.
- Peak sales month: July generates the highest monthly revenue, reaching approximately $72.500.
- Revenue trend: Overall, pizza sales have been steadily increasing throughout the year, with a noticeable spike during mid-year peak in July and significant decline in December.
Recommendations
Based on key findings from sales data, the business can implement the following strategic actions to optimize operations, increase revenue, and better serve customers:
- Create combo deals that bundle large pizzas with sides and drinks to increase AOV above the current $38.31.
- Prominently feature best-selling pizzas on the menu and in marketing materials to drive sales.
- Prioritize stocking ingredients for large pizzas and classic pizzas to ensure availability and reduce wait times for customers.
- Capitalize on the high-demand month by creating special summer deals, combo bundles, and limited-time offers to maximize sales.
In conclusion, these findings provide valuable insights into the demographics and preferences of pizza buyers. By implementing these practical steps, businesses can increase sales and better meet the needs and interests of their target market.