Project Overview
Goal
Our goal is to identify the ideal customer for a bicycle shop. To achieve this, we will analyze customer data from an Excel spreadsheet containing information on Marital Status, Gender, Income, Children, Education, Occupation, Home Ownership, Car, Mileage, Region, Age, and Bikes Purchased.
Download from GitHub!Setup
To begin this project, data cleaning was performed to ensure accurate analysis. This included removing duplicate entries to avoid potential bias in the dataset. Next, the data was updated to make it easier to interpret, for example, replacing "M" and "F" with "Male" and "Female," and "M" and "S" with "Married" and "Single." Age groupings were also created to facilitate better data visualization. Furthermore, I ensured there were no missing data and that each column had the correct data type.
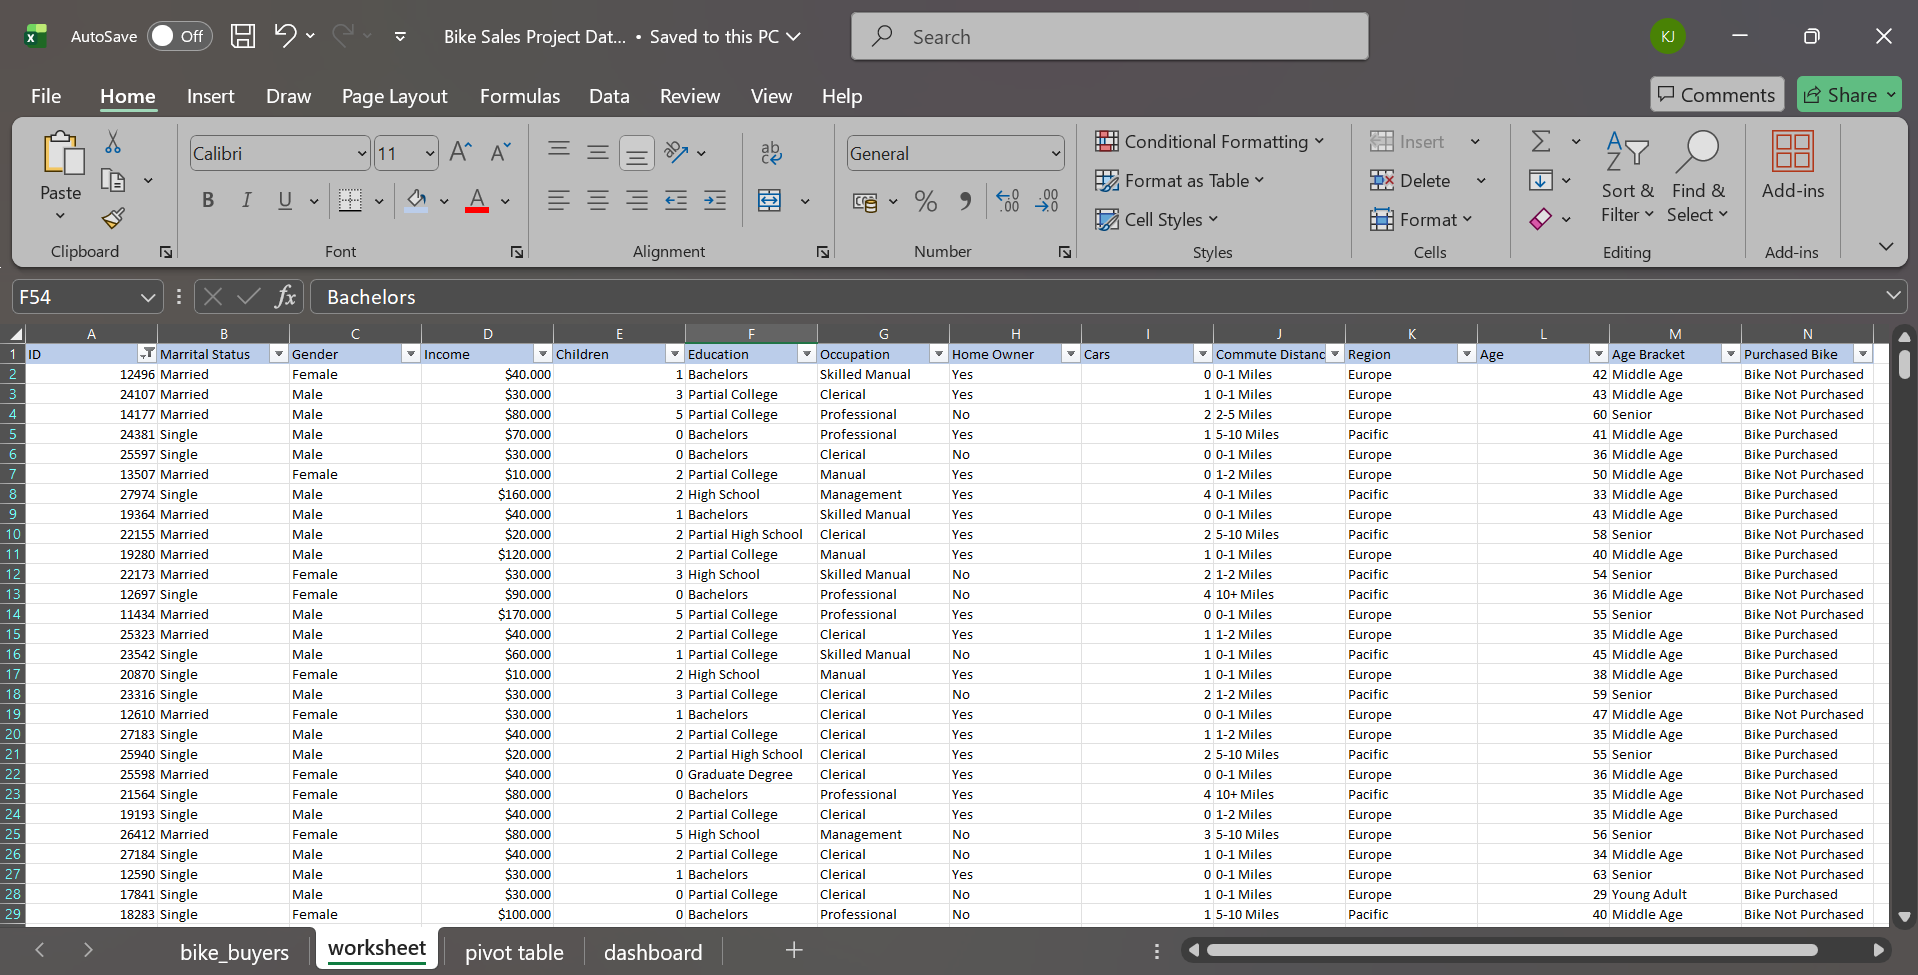
Fig 1. This image shows the dataset after it was cleaned.
These steps are essential to ensure that the data is formatted appropriately for analysis and will produce accurate results. We initially started with 1026 data sets, and now we have 1000.
Analysis
Now that we have clean data, we can perform exploratory data analysis to gain insights and patterns in the data.
Business Questions:
- What is the most common age group of customers who purchase bikes from the shop?
- What is the most common gender of customers who purchase bikes from the shop?
- What is the most common income range of customers who purchase bikes from the shop?
- What is the most common education level of customers who purchase bikes from the shop?
- What is the most common occupation of customers who purchase bikes from the shop?
- What is the most common region of customers who purchase bikes from the shop?
- What is the most common commute distance of customers who purchase bikes from the shop?
- What is the most common number of cars owned by customers who purchase bikes from the shop?
- Does the marital status of customers have any correlation with the likelihood of purchasing a bike from the shop?
- Does being a home owner have any correlation with the likelihood of purchasing a bike from the shop?
By answering these questions, bike shops can develop a better understanding of their ideal customer and tailor their marketing strategies to attract more of these customers.
Data Exploration
We will start by grouping customers based on age, gender, income, marital status, etc.
I used customer data to create pivot tables that group customers based on various criteria. Using these groups, I created charts that display key insights. I also used various functions to perform calculations.
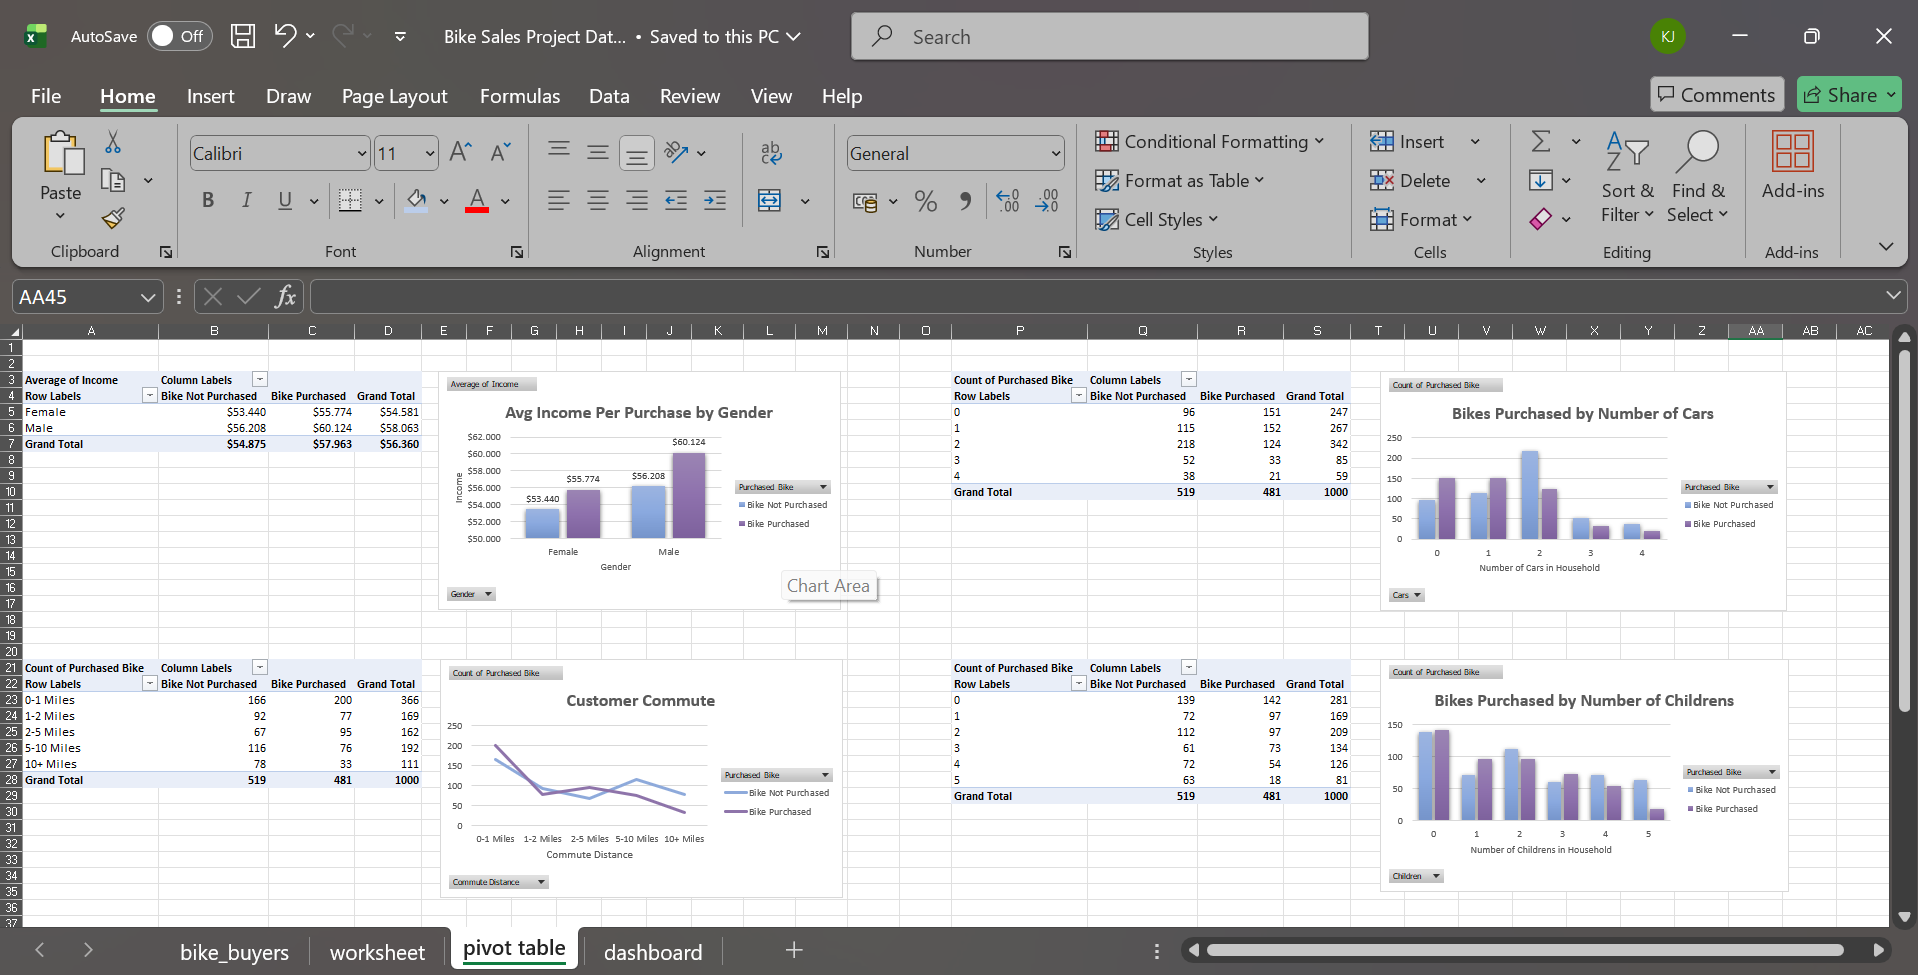
Fig 2. This image shows the different pivot tables and charts.
To easily view all this information at once, I created a dashboard that displays all the graphs. I also added a slicer feature to the dashboard, allowing users to filter the data based on various criteria. This makes it easier to identify the customer segments most likely to buy bikes.
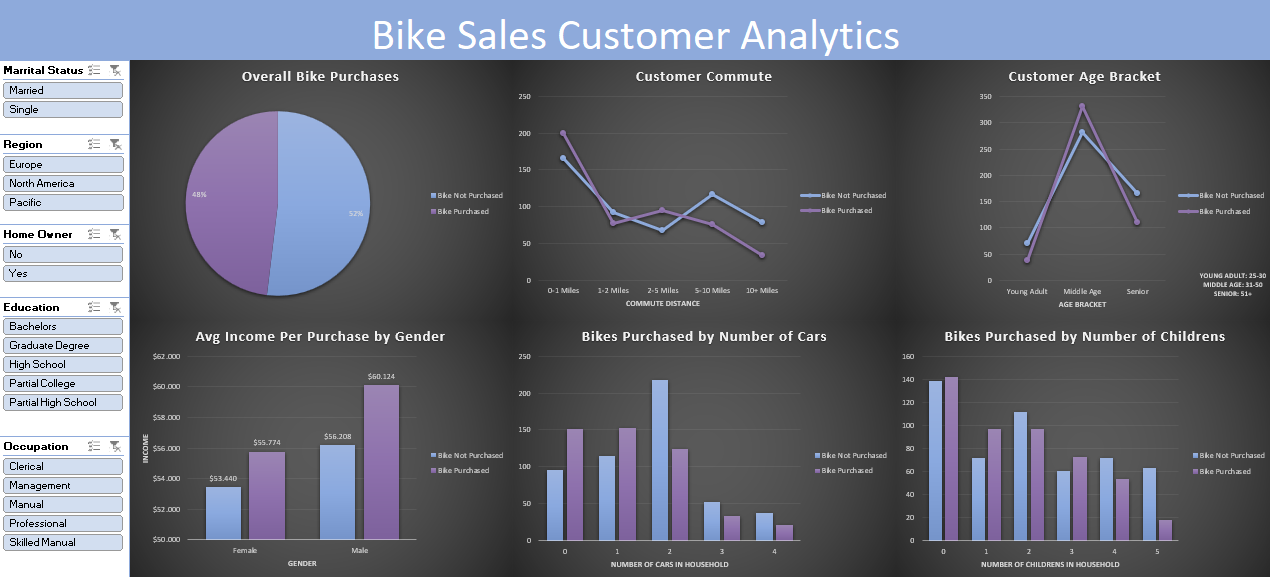
Fig 3. This image shows the Bike Sales Dashboard.
Key Findings
Using the dashboard, we were able to determine the following insights:
- Age group: The largest group of bicycle buyers is in the middle age range, 31-50 years.
- Education level: The majority of customers who purchased bicycles had completed high school education.
- Occupation: The most common occupation among bicycle buyers is professional.
- Region: Pacific is the region where most bicycle purchases are made.
- Commute distance: Most bike buyers have a commute distance of 0-1 mile.
- Number of cars owned: Majority of bike buyers own 0-1 car.
- Number of children: Most bike buyers do not have children.
- Marital status: Single customers are more likely to purchase a bike, perhaps due to more income for personal hobbies and fitness.
- Home ownership: There is no significant correlation between being a homeowner and the likelihood of purchasing a bicycle.
Recommendations
Based on these findings, the business can implement the following actionable steps to improve sales:
- Target your marketing efforts to the middle-aged age group, 31-50, who are the largest group of bicycle buyers. This can be done through targeted advertising, promotions, and events.
- Meet the needs and interests of customers in professional positions, which are the most common occupations among bicycle buyers. This can be done by offering high-end, performance-focused bicycles and accessories.
- Focus sales efforts on Pacific, which is the region where most bike purchases are made. This can involve increasing inventory and offering promotions specific to this region.
- Focus on unmarried customers by offering promotions and products that align with their interests in personal hobbies and fitness.
In conclusion, these findings provide valuable insights into the demographics and preferences of bicycle buyers. By implementing these practical steps, businesses can increase sales and better meet the needs and interests of their target market.